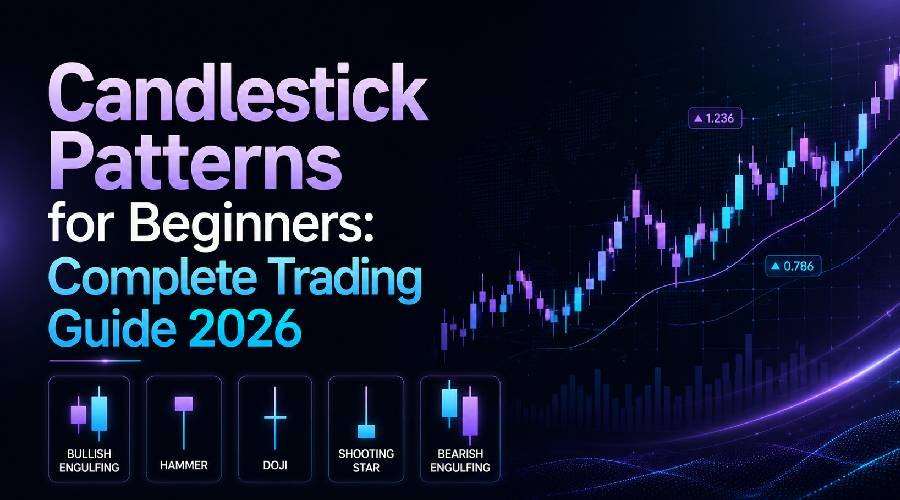
Candlestick patterns for beginners are one of the easiest ways to understand price movement in Forex and Gold trading. Instead of looking at plain line charts, candlestick charts show who is controlling the market: buyers or sellers.
Forex traders use candlestick patterns because they help identify possible reversals, trend continuation, entry zones, and exit areas. For example, if XAUUSD forms a bullish engulfing candle near support, traders may see it as a possible buying opportunity. However, candlestick signals should never be used alone. They work best with support, resistance, trend direction, and risk management.
If you are completely new to currency markets, first read our beginner guide on What is Forex Trading to understand how Forex price movement works
Candlestick patterns are price formations on a trading chart that show market psychology. Beginners use them to identify possible buy or sell signals in Forex, Gold, and other markets.
What Is a Candlestick in Trading?
A candlestick is a chart candle that shows price movement during a specific time period. This could be 1 minute, 15 minutes, 1 hour, 1 day, or any timeframe.
Each candle has four main parts:
Candle Part | Meaning |
Open | Price where the candle started |
Close | Price where the candle ended |
High | Highest price reached |
Low | Lowest price reached |
Body | Distance between open and close |
Wick | Price rejection above or below the body |
If the close price is higher than the open price, it is usually a bullish candle. If the close price is lower than the open price, it is usually a bearish candle.
Candlestick Chart Explained
A candlestick chart explained simply means reading candles to understand price action. Every candle tells a small story. A group of candles tells a bigger story about trend, momentum, and market behavior.
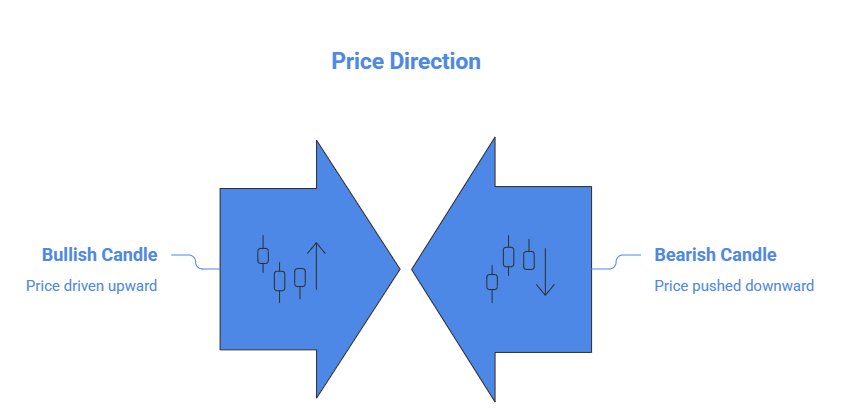
Bullish vs Bearish Candles
A bullish candle shows that buyers pushed the price higher. A bearish candle shows that sellers pushed the price lower.
For example, if EUR/USD opens at 1.0850 and closes at 1.0900, the candle is bullish because price increased. If XAUUSD opens at 2350 and closes at 2340, the candle is bearish because price dropped.
Bullish Candlestick Patterns
Bullish candlestick patterns suggest that buyers may be gaining control. They are often stronger when they appear near support or after a downtrend.
– Hammer
A hammer has a small body and a long lower wick. It shows that sellers pushed price down, but buyers came back strongly.
Best use: Near support after a bearish move.
Beginner tip: Wait for the next candle to close bullish before entering.
– Bullish Engulfing
A bullish engulfing pattern forms when a large bullish candle fully covers the previous bearish candle.
Best use: Reversal setup after a downtrend.
Example: If EUR/USD falls into support and then forms a bullish engulfing candle, traders may watch for a buy setup.
– Morning Star
The morning star is a three-candle reversal pattern. It usually appears after a downtrend and shows that selling pressure is weakening.
Best use: Strong reversal areas.
Beginner tip: Use support and RSI confirmation.
– Piercing Line
The piercing line forms when a bullish candle opens lower but closes above the middle of the previous bearish candle.
Best use: Early reversal signal after price weakness.
Beginner tip: Avoid trading it during strong downtrends without confirmation.
Bearish Candlestick Patterns
Bearish candlestick patterns suggest that sellers may be gaining control. They are usually more reliable near resistance or after an uptrend.
– Shooting Star
A shooting star has a small body and a long upper wick. It shows buyers pushed price up, but sellers rejected the move.
Best use: Near resistance after an upward move.
Example: If XAUUSD rises into resistance and forms a shooting star, traders may watch for a possible sell setup.
– Bearish Engulfing
A bearish engulfing pattern forms when a strong bearish candle fully covers the previous bullish candle.
Best use: Reversal after an uptrend.
Beginner tip: Confirm with resistance or trendline rejection.
– Evening Star
The evening star is a three-candle bearish reversal pattern. It suggests that buying pressure is fading.
Best use: Market tops or strong resistance zones.
Beginner tip: Wait for the third candle to close clearly bearish.
– Hanging Man
A hanging man looks like a hammer but appears after an uptrend. It warns that sellers may be entering the market.
Best use: After extended bullish moves.
Beginner tip: Do not sell immediately. Wait for confirmation.
Single Candlestick Patterns Explained
Single candlestick patterns are useful because they are easy to spot, but they need context.
1. Doji
A Doji forms when open and close prices are almost the same. It shows market indecision.
Best use: Near support, resistance, or trend exhaustion.
2. Hammer
The hammer shows buyer rejection from lower prices. It can signal a possible bullish reversal.
3. Marubozu
A Marubozu candle has little or no wick. It shows strong buying or selling pressure.
Best use: Trend continuation or strong breakout candles.
Best Candlestick Patterns for Beginners
The best candlestick patterns for beginners are simple, visual, and easy to confirm.
Pattern | Signal Type | Best Location |
Hammer | Bullish reversal | Support |
Bullish Engulfing | Bullish reversal | After downtrend |
Shooting Star | Bearish reversal | Resistance |
Bearish Engulfing | Bearish reversal | After uptrend |
Doji | Indecision | Key levels |
Marubozu | Momentum | Breakout zones |
For beginners, the 15-minute, 1-hour, and 4-hour timeframes are often easier than very low timeframes because they reduce noise.
If you are unsure which timeframe suits your trading personality, read our guide on the Difference Between Scalping and Day Trading before choosing a candlestick trading style.
Forex Candlestick Patterns
Forex candlestick patterns help traders understand buyer and seller behavior in currency pairs. They are commonly used in EUR/USD, GBP/USD, USD/JPY, and XAUUSD.
XAUUSD Example
If Gold drops to support at 2320 and forms a bullish engulfing pattern, it may show buyers are defending that level. A trader may wait for a break above the candle high before entering.
EUR/USD Example
If EUR/USD rises into resistance and forms a shooting star, it may suggest sellers are rejecting higher prices. A trader may wait for a bearish confirmation candle before selling.
Candlestick Trading Strategy
A simple candlestick trading strategy should include entry, exit, and risk rules.
Basic Rules
1. Identify the trend.
2. Mark support and resistance.
3. Wait for a candle pattern.
4. Confirm with RSI, volume, or moving average.
5. Enter only after confirmation.
6. Place stop loss beyond the candle wick.
7. Set take profit near the next key level.
This process helps avoid random candle chart trading.
Price Action Candlestick Patterns
Price action candlestick patterns show market psychology. A long wick means rejection. A strong body means momentum. A Doji means uncertainty.
For example, a long lower wick near support means sellers tried to push price down, but buyers rejected the move. This can show possible bullish pressure.
Candlestick analysis works better when traders understand the story behind the candle, not just the shape.
Candlestick Signals and Confirmation
Candlestick signals become stronger with confirmation.
Useful confirmations include:
For stronger confirmation, traders can also study the Best Forex Trading Indicators and combine them with candlestick analysis.
– Volume confirmation: Higher volume can support the candle signal.
– RSI confirmation: RSI can show overbought or oversold conditions.
– Trend confirmation: Trading with the trend improves probability.
– Support/resistance confirmation: Patterns at key levels are stronger.
A candle pattern in the middle of nowhere is usually weaker than one at a clear market level.
Common Mistakes Beginners Make
Beginners often make mistakes because candlestick patterns look easy.
Avoid these errors:
1. Trading every candle pattern
2. Ignoring the main trend
3. Entering without confirmation
4. Using no stop loss
5. Overtrading small timeframes
6. Risking too much on one setup
7. Memorizing patterns without understanding market context
The goal is not to find many trades. The goal is to find better trades.
Candlestick Pattern Cheat Sheet
Pattern | Type | Meaning | Beginner Action |
Hammer | Bullish | Buyers reject lower price | Watch for buy confirmation |
Bullish Engulfing | Bullish | Buyers overpower sellers | Confirm near support |
Morning Star | Bullish | Downtrend may reverse | Wait for third candle close |
Shooting Star | Bearish | Sellers reject higher price | Confirm near resistance |
Bearish Engulfing | Bearish | Sellers overpower buyers | Confirm with trend/resistance |
Evening Star | Bearish | Uptrend may reverse | Wait for bearish close |
Doji | Neutral | Market indecision | Wait for direction |
Marubozu | Momentum | Strong buying/selling | Use with breakout strategy |
Conclusion
Candlestick patterns for beginners are powerful because they make price movement easier to understand. They help traders read market psychology, spot possible reversals, and improve entries in Forex and XAUUSD trading.
However, candles are not magic signals. Beginners should practice on demo accounts, use support and resistance, confirm signals with trend direction, and manage risk on every trade.
If you want to trade smarter, start by learning one or two candlestick patterns deeply before adding more. Consistency matters more than memorizing every pattern.
FAQ
What are candlestick patterns for beginners?
Candlestick patterns for beginners are simple chart formations that help new traders understand price movement, buyer strength, seller pressure, and possible trading signals.
What is the best candlestick pattern for beginners?
The bullish engulfing, bearish engulfing, hammer, and shooting star are among the best candlestick patterns for beginners because they are easy to identify and use with support and resistance.
Do candlestick patterns work in Forex trading?
Yes, candlestick patterns can work in Forex trading when combined with trend analysis, support and resistance, risk management, and confirmation tools.
Which timeframe is best for candlestick patterns?
For beginners, the 15-minute, 1-hour, and 4-hour charts are often better because they provide cleaner candlestick signals than very low timeframes.
Can candlestick patterns predict the market?
Candlestick patterns cannot predict the market with certainty. They show possible buyer or seller behavior, but traders should always use confirmation and stop loss.